
This guide explains how to activate WordPress debug mode and generate the debug.log file. It is typically used when dealing with issues such as fatal errors or a blank white screen on a WordPress website.
Debug mode can be enabled by editing specific lines within the wp-config.php file of your WordPress installation.
To activate WordPress debugging, follow these steps:
- Access your server via cPanel or connect to your website using FTP
- Open the File Manager in cPanel or use your FTP client to locate and edit the wp-config.php file
- Add the following lines to wp-config.php, or update them if they are already present:
define( 'WP_DEBUG', true );
define( 'WP_DEBUG_LOG', true );
define( 'WP_DEBUG_DISPLAY', false );
IMPORTANT: Ensure the code is copied exactly as provided, including all semicolons and characters.
4. Insert the copied lines immediately before the following line:
/* That's all, stop editing! Happy publishing. */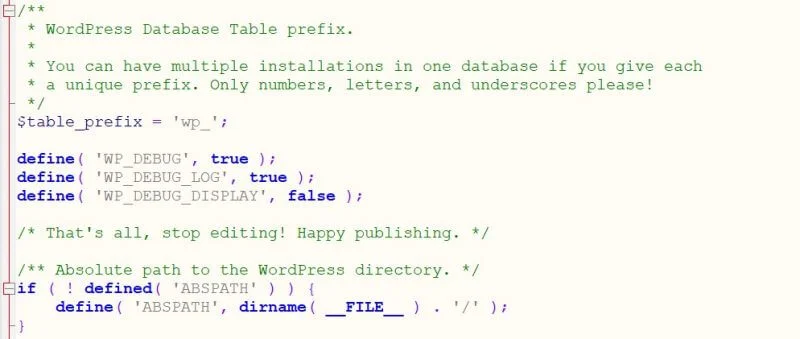
 Proceed carefully with the following step, as it will display PHP errors on the frontend, making them visible to visitors. For security reasons, remember to disable WP_DEBUG once the issue has been resolved.
To display debug errors directly on screen instead of checking the debug.log file, modify the following line:
define( 'WP_DEBUG_DISPLAY', false );to
define( 'WP_DEBUG_DISPLAY', true );If configured correctly, errors will be recorded in the debug.log file and/or shown on screen, helping identify conflicts and resolve the issue.
For more detailed guidance on enabling WordPress debug mode, refer to https://wordpress.org/support/article/debugging-in-wordpress/.